When something has already gone wrong, most people think about bloodwork. A doctor orders tests, a number comes back abnormal, and treatment begins. That manages disease. It doesn’t prevent it. Tracking your biomarkers for longevity flips that sequence entirely, you’re collecting data on your biology before symptoms appear, so you can intervene years or even decades ahead of a clinical diagnosis.
Chronic diseases like heart disease, type 2 diabetes, and cancer account for roughly 90% of global healthcare spending, yet most are preventable through early detection and lifestyle change. The problem isn’t that the science is new. It’s that routine medicine still runs on a reactive structure, ordering minimal panels, interpreting results against outdated benchmarks, and reserving detailed testing for people who are already sick.
You don’t have to wait for that system to catch up.
Why “Normal” Lab Results Aren’t Enough
When your test results are ready, you will notice a reference range next to each value. If your result is within that range, you are informed that everything is normal. What many people do not realize is that these ranges are based on population averages, which are derived from a population that is mostly sedentary, metabolically dysfunctional, and inflamed.
“Normal” means average in that situation. It doesn’t mean best.
For example, a fasting glucose of 99 mg/dL falls within the typical reference range. But if it was 82 three years ago, that shift is warning you of something. An hs-CRP of 1.8 mg/L is within the acceptable range, but optimal-for-longevity physicians recommend targeting less than 1.0. Understanding the difference between a range that keeps you from being diagnosed with a disease and a range that is consistent with being free of disease and disability for a long, vibrant life is the key point.
Building a Cost-Effective Panel Without Insurance
Insurance doesn’t cover longevity medicine; it covers what’s medically necessary, which means the advanced markers most relevant to prevention don’t get covered until you have disease. The good news is that direct-to-consumer blood testing has made it possible to self-order lab panels without a physician referral and without insurance gatekeeping. The bad news is that ordering a comprehensive longevity panel piecemeal can become expensive fast.
The smarter approach is to plan your panel in advance, prioritize based on your current health focus, and bundle strategically to avoid paying for redundant markers. For those building or pricing out a custom panel, you can use the LabTestSuperstore bloodwork budget tool to compare individual test pricing, bundle your desired longevity biomarkers, and ultimately build a panel that fits a real-world budget rather than a clinical protocol.
The patient shifts to the CEO of their own health: you decide what to measure, when, and why.
The Cardiovascular Panel That Actually Matters
A regular lipid panel gives you total cholesterol, HDL, LDL, and triglycerides. It’s a solid snapshot, but let’s not oversell it, it leaves more important information on the table. The two most clinically relevant and concerning lipid markers, ApoB and Lipoprotein(a), aren’t even run on most routine panels.
Apolipoprotein B (ApoB) measures the actual number of atherogenic particles in your blood, the ones that lodge in your arterial wall and lead to plaque formation. LDL cholesterol is a less precise, slightly downstream measurement. You can have a favorable LDL cholesterol level while your particle count is screaming high, and vice versa. ApoB tests for the actual number of atherogenic particles, making it a more accurate gauge of risk and often more sensitive to improvement than LDL cholesterol.
Lipoprotein(a), often written as Lp(a), is a genetically determined particle that amplifies cardiovascular risk like few others. It is sparingly modified by diet and exercise because it is genetically predetermined to hang around in your bloodstream. In other words, if your Lp(a) is high, it will be high throughout your life. If it’s low, that too won’t change. Most adults haven’t once been tested for it, however. You only need to measure it once or twice in a lifetime: as your Lp(a) level is unlikely to change, once you know you have high Lp(a), you know it’s going to be high. But knowing whether you carry elevated Lp(a) profoundly changes how aggressively you should manage every other modifiable risk factor.
Reading Metabolic Health Beyond Glucose
A fasting blood glucose test can easily be fooled. You can still have a functional metabolism, yet be failing the fasting glucose. Two tests give you a much better window.
HbA1c gives you the average of your blood sugars over roughly three months. It’s less easily manipulated by short-term changes in behavior than fasting glucose is (since it’s a sort of running average). But it can also lag, it’s not all that useful to tell you your average over the last three months is fine if one month ago your pancreas maxed out for the fifth time.
Fasting insulin often starts to go wonky five, ten years or more before glucose does, and the reason is simple. When cells in your body start acting resistant to the message of insulin (taking up sugar in the blood), your pancreas puts out more insulin to send the same message. So you can be failing at insulin for years before it becomes obvious, years before it actually stops being able to push your blood sugar down into the “normal” range.
The HOMA-IR calculation takes it a step further. It multiplies fasting glucose by fasting insulin and divides by a constant, producing a single number that estimates insulin resistance directly. A HOMA-IR above 2.0 is worth taking seriously. Above 2.5 indicates meaningful insulin resistance even when glucose and HbA1c are still reading normal.
This is exactly the kind of window that standard annual bloodwork misses.
Inflammation, Homocysteine, and Biological Aging
In longevity research, they call it “inflammaging”: the low-grade, chronic inflammation that builds with age and quietly triggers heart disease, neurodegeneration, and metabolic syndrome. It almost never manifests as acute symptoms. You feel fine. But it appears on your blood test if you know where to look.
hs-CRP (high-sensitivity C-reactive protein) is the standard metric. It gives a read on systemic inflammation and, unlike a standard CRP test, picks up cardiovascular risk at levels that would otherwise go unnoticed. If your hs-CRP always exceeds 1.0 mg/L, it’s worth discovering the cause, whether it’s your diet, the quality of your sleep, your visceral fat, or your gut.
Homocysteine is different, an often overlooked marker. It’s an amino acid that accumulates when certain B vitamins, particularly B12, B6, and folate, are insufficient for proper methylation. Elevated homocysteine is independently linked to both cardiovascular events and cognitive decline, and it’s one of the more actionable markers because the intervention is straightforward: correct the nutritional deficiencies driving it.
Vitamin D3 (measured as 25-hydroxyvitamin D) and DHEA-S round out an inflammation and aging-focused panel. Vitamin D operates more like a hormone than a nutrient: virtually all tissue types have receptors, and chronic deficiency is associated with immune dysfunction and higher all-cause mortality. DHEA-S is an adrenal hormone that falls with age and serves as a rough proxy for biological versus chronological age, monitoring it over several years gives you a helpful endocrine trend line.
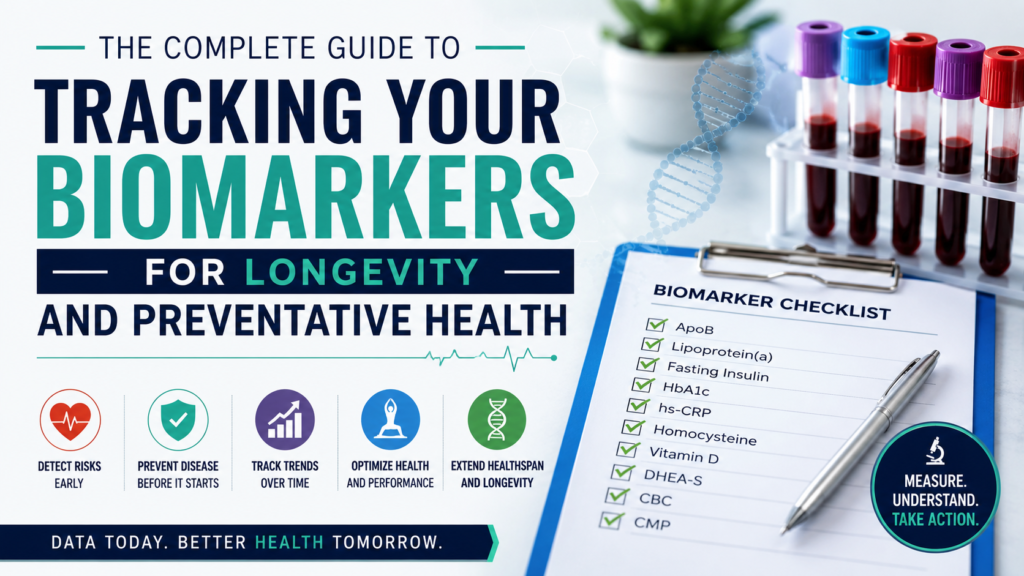
The Foundation: CBC and CMP
Before you start obsessing about a top-tier longevity panel, make sure you’ve got the basics covered. A Complete Blood Count (CBC) provides an overview of your blood cell populations, red cells, white cells, and platelets, and can alert you to the presence of anemia, immune activity, and inflammatory signals at a fundamental level. A Comprehensive Metabolic Panel (CMP) includes kidney function, liver enzymes, electrolytes, and blood glucose.
These two panels are low cost, available just about anywhere, and determine the organ function baseline upon which everything else is built. It’s not particularly useful to start tracking advanced cardiovascular markers if you don’t know the current state of how your kidneys and liver are handling the load.
How to Prepare For Accurate Results
For accurate biomarker data, it is essential that certain conditions are met during collection.
Fasting for 10 to 12 hours before the test is a common practice for glucose, insulin, and lipid panels. You can still drink water. However, coffee, even black coffee, is off-limits as it may impact cortisol and glucose levels. For hormone testing, it is best to take the sample in the morning when hormone levels are at their natural peak. This especially applies to testosterone and cortisol testing.
One often overlooked factor is biotin supplementation. Many thyroid and hormone tests use biotin chemistry, which can be found in hair and nail supplements. Before a blood draw, stop taking biotin supplements for at least 48 to 72 hours if you want accurate results.
Engaging in intense physical activity within 24 hours of the test may temporarily increase the levels of CRP, creatine kinase, and some liver enzymes. Inadequate sleep may result in higher levels of cortisol and glucose. While it is important to stay hydrated before the test, don’t overdo it as it may affect sodium and other electrolyte readings.
If you are collecting data over a period of time, then the preparation protocol should be consistent for each test.
Testing Cadence: Annual, Quarterly, and Targeted
For most people starting out, a full comprehensive annual panel is the right foundation. This should cover CBC, CMP, a full lipid panel including ApoB, fasting glucose, fasting insulin, HbA1c, hs-CRP, homocysteine, vitamin D, and DHEA-S. This is your baseline. Every subsequent result is compared against it.
When you’re actively experimenting, changing your diet, starting a new supplement protocol, adjusting training volume, quarterly testing on a targeted subset of relevant markers lets you see whether what you’re doing is working. If you’re addressing elevated homocysteine with B vitamin supplementation, you want to retest in 90 days, not 12 months.
Lp(a) and genetic markers only need to be measured once. Markers like ApoB, fasting insulin, and hs-CRP benefit from regular retesting because they respond to lifestyle interventions and you need to see the direction of travel over time.
Tracking Longitudinally: Why a Single Number Tells You Little
Think of it this way. A single lab result is a photograph. A series of results over time is a film, and the trend tells you far more than any individual frame. An hs-CRP that reads 0.8 mg/L is fine in isolation, but if it was 0.3 two years ago and 0.6 last year, that upward drift is meaningful information even though all three readings fall within normal range.
Build a simple spreadsheet with the date of each draw, the values for each marker, and notes about recent lifestyle changes. Over two or three years, patterns emerge. Organ function markers like creatinine and GFR often decline slowly and subtly long before they cross a clinical threshold, and spotting that decline early is exactly the point.
Biomarker volatility is real. One anomalous reading doesn’t mean something is wrong. Two consecutive elevated readings means something is worth investigating. The longitudinal view prevents both unnecessary panic and missed signals.
The goal isn’t to optimize a number on a lab report. It’s to understand the direction your biology is moving and stay ahead of where it’s going.


